Viewing microcontroller logs via the platform web interface
The developer can use the 2Smart Cloud platform web interface to view ESP32 microcontroller logs. It doesn’t matter what base the firmware for the device is written on – ESPHome or custom.
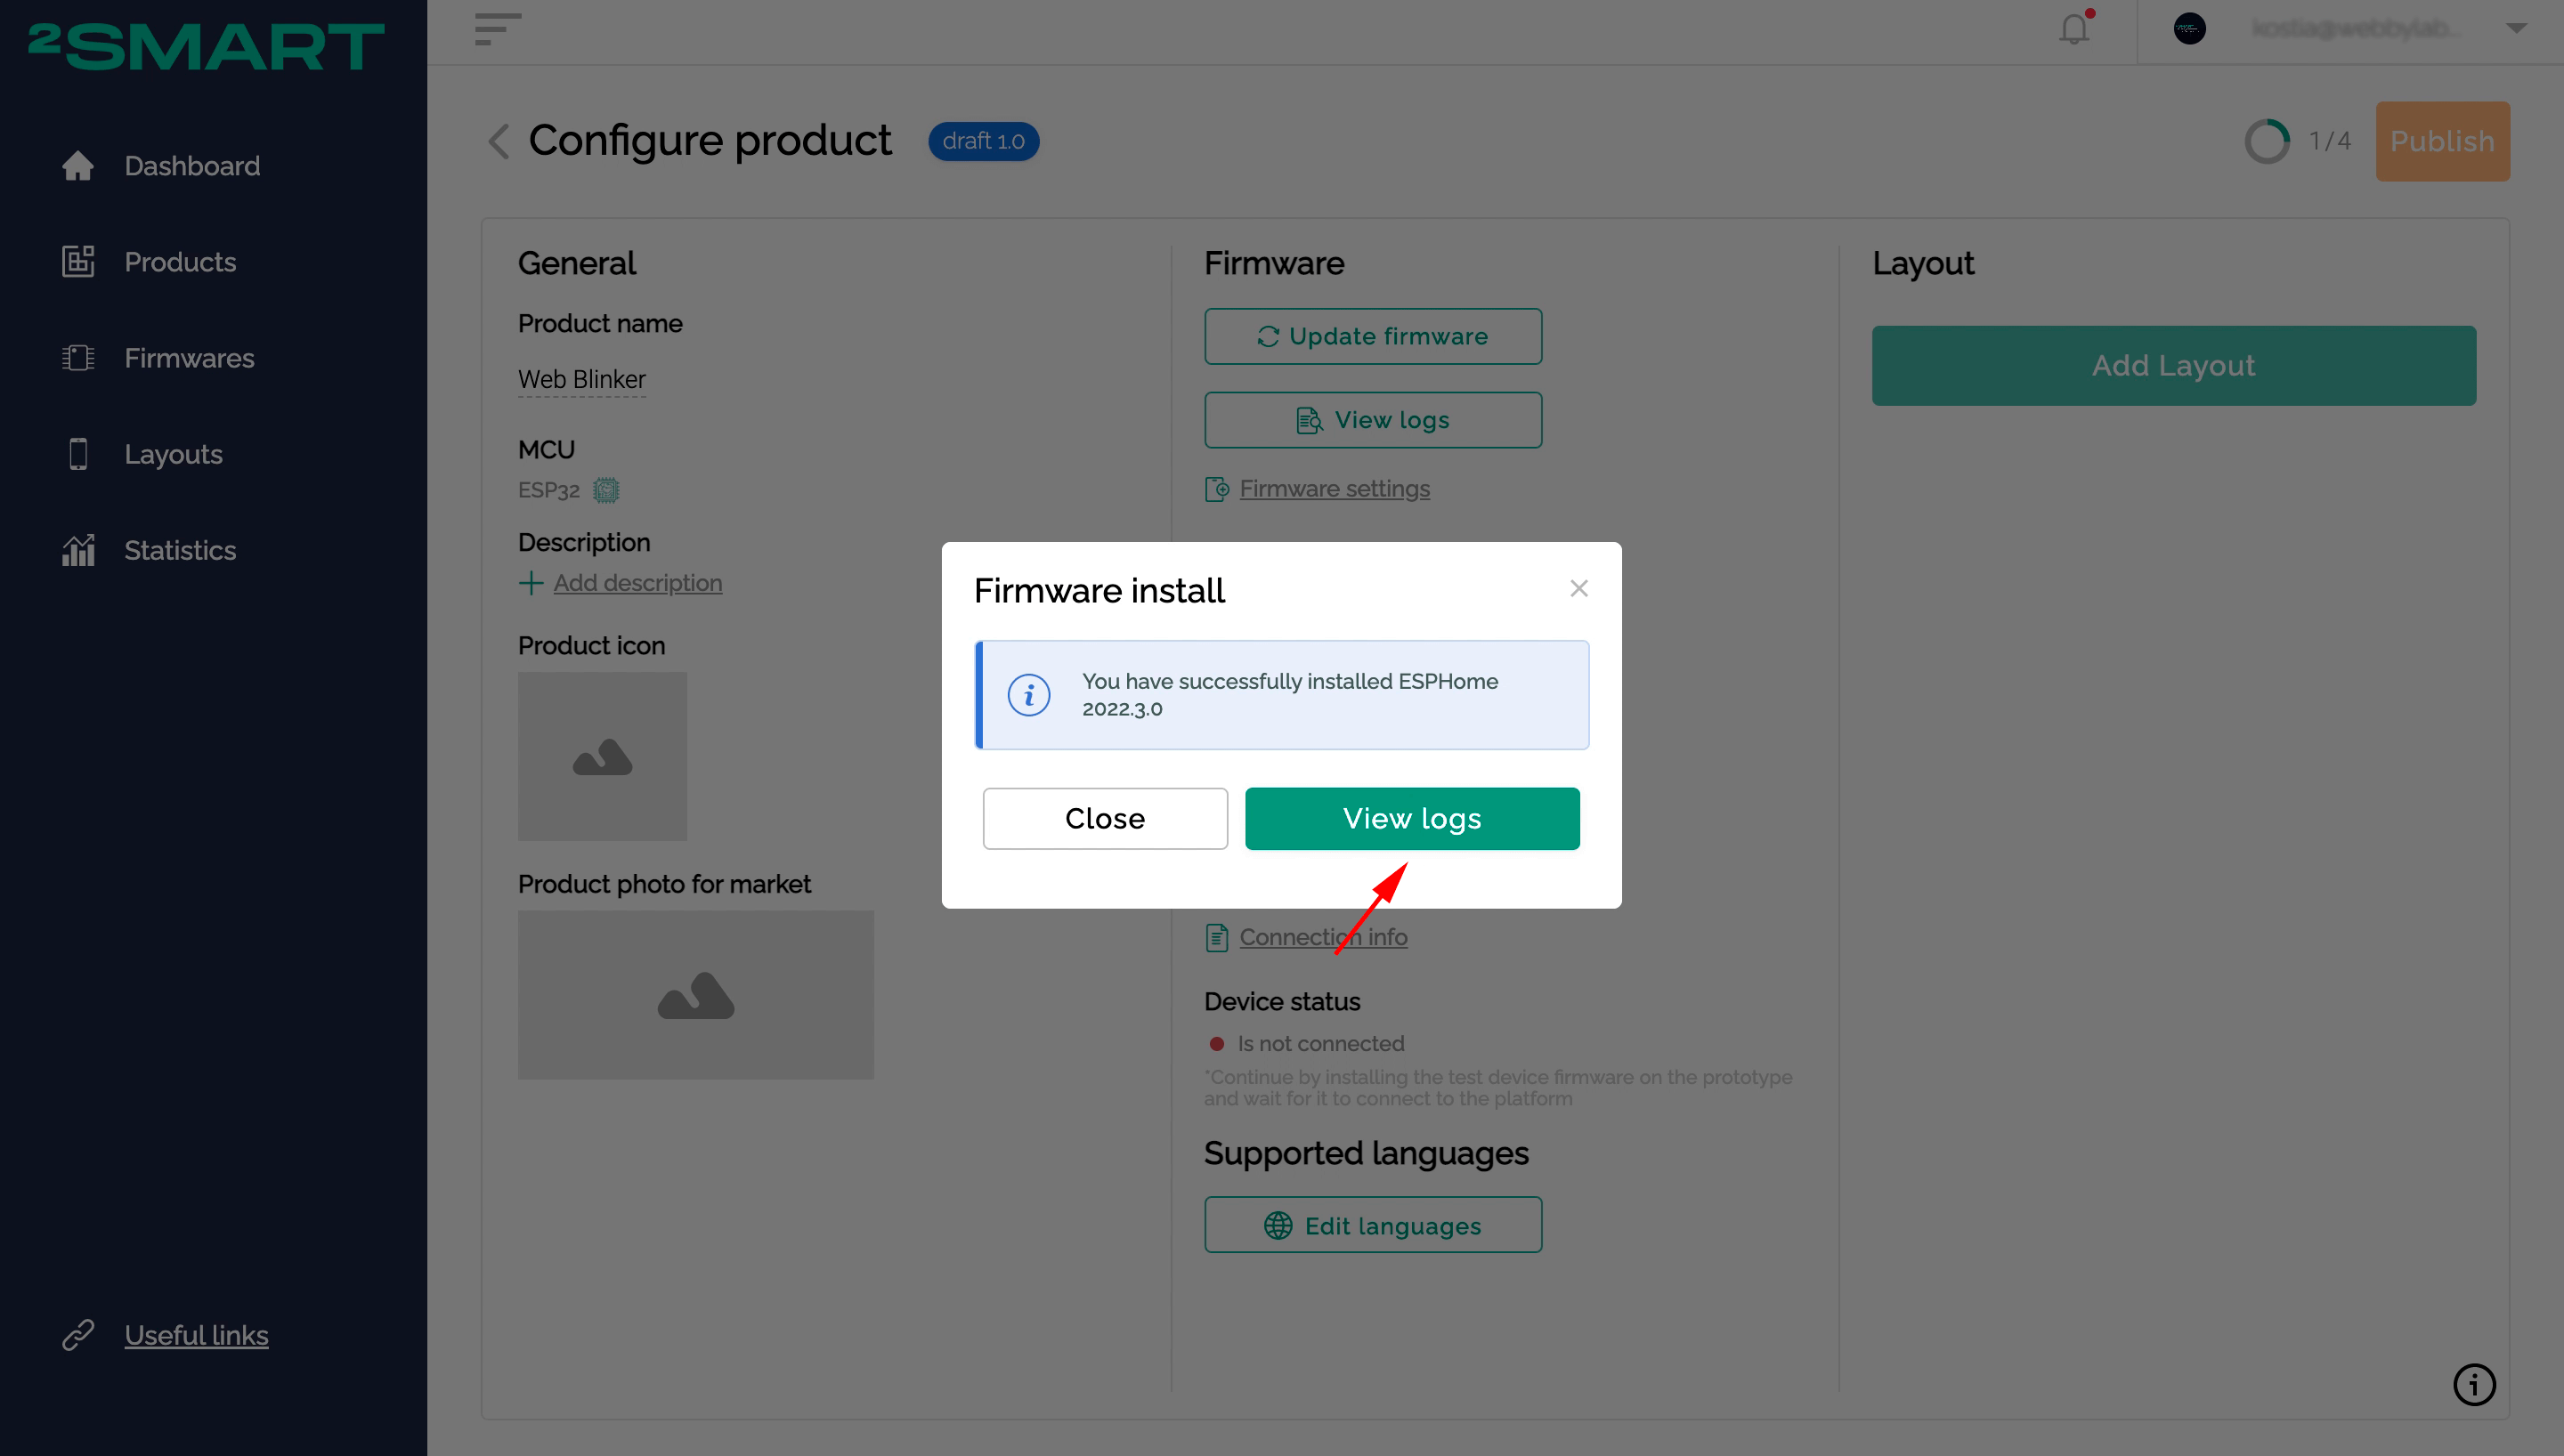
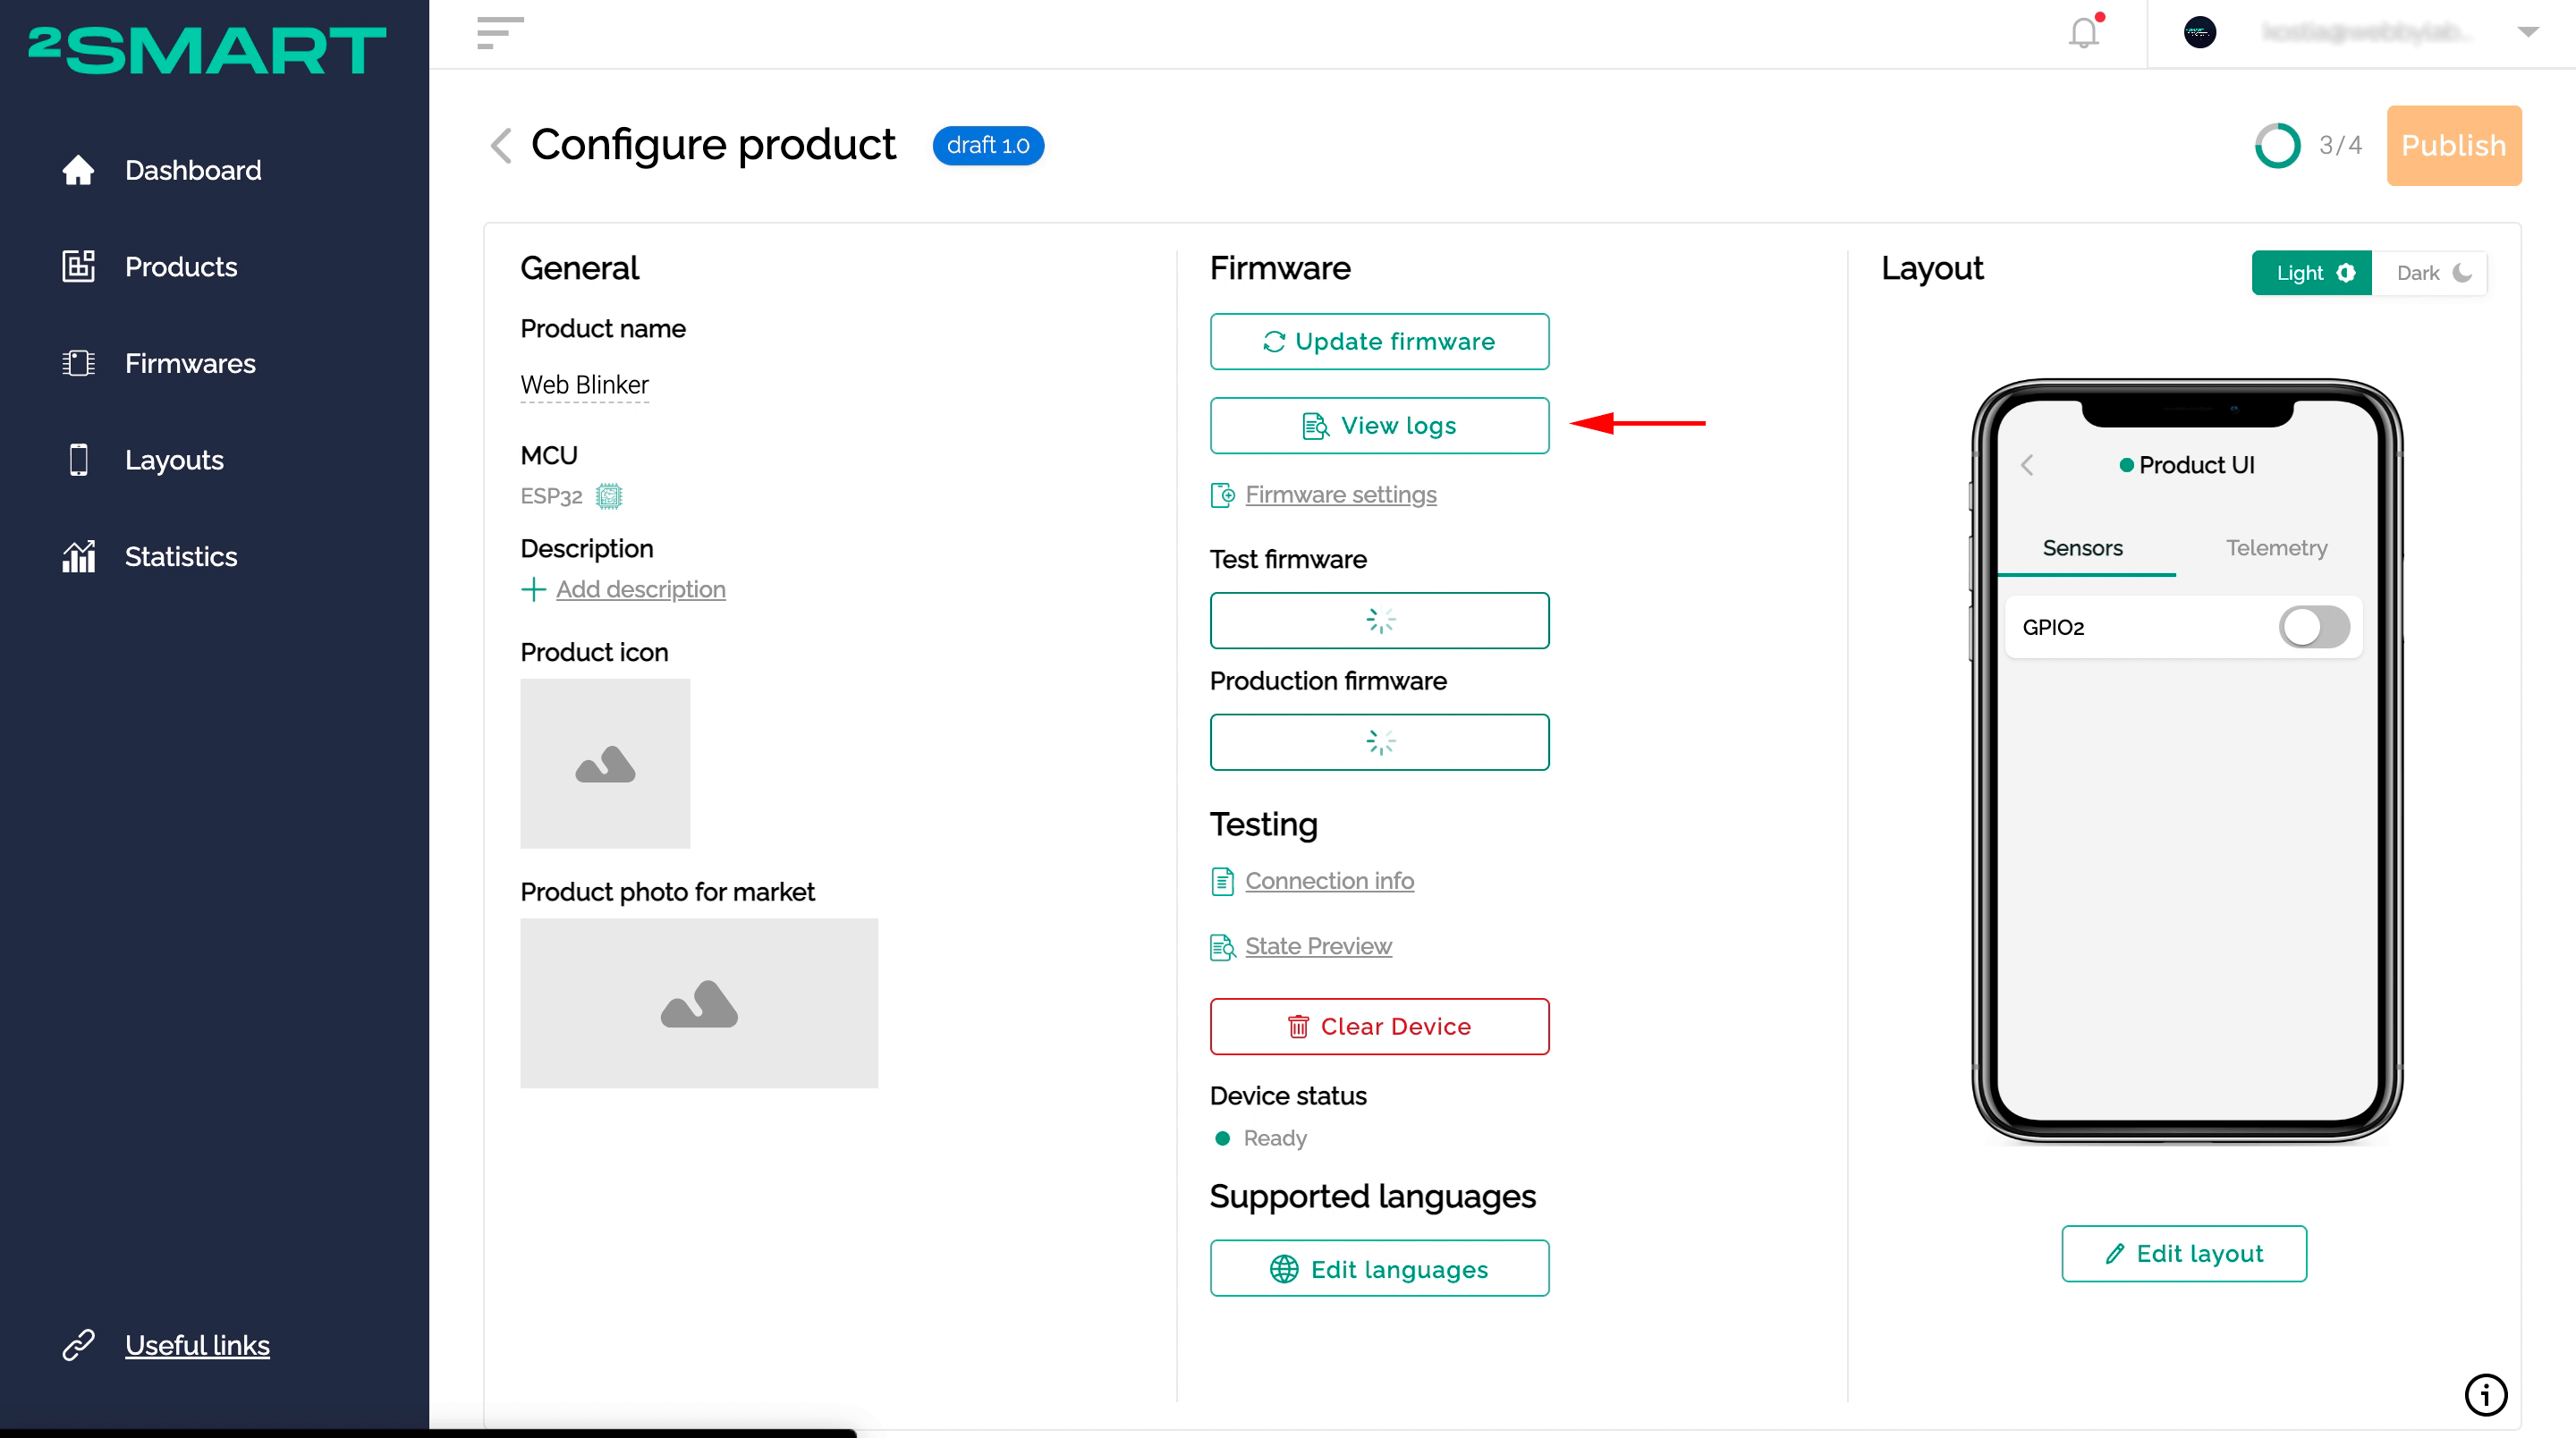
Click the “View logs” button on the successful device flashing notification or the product page window.
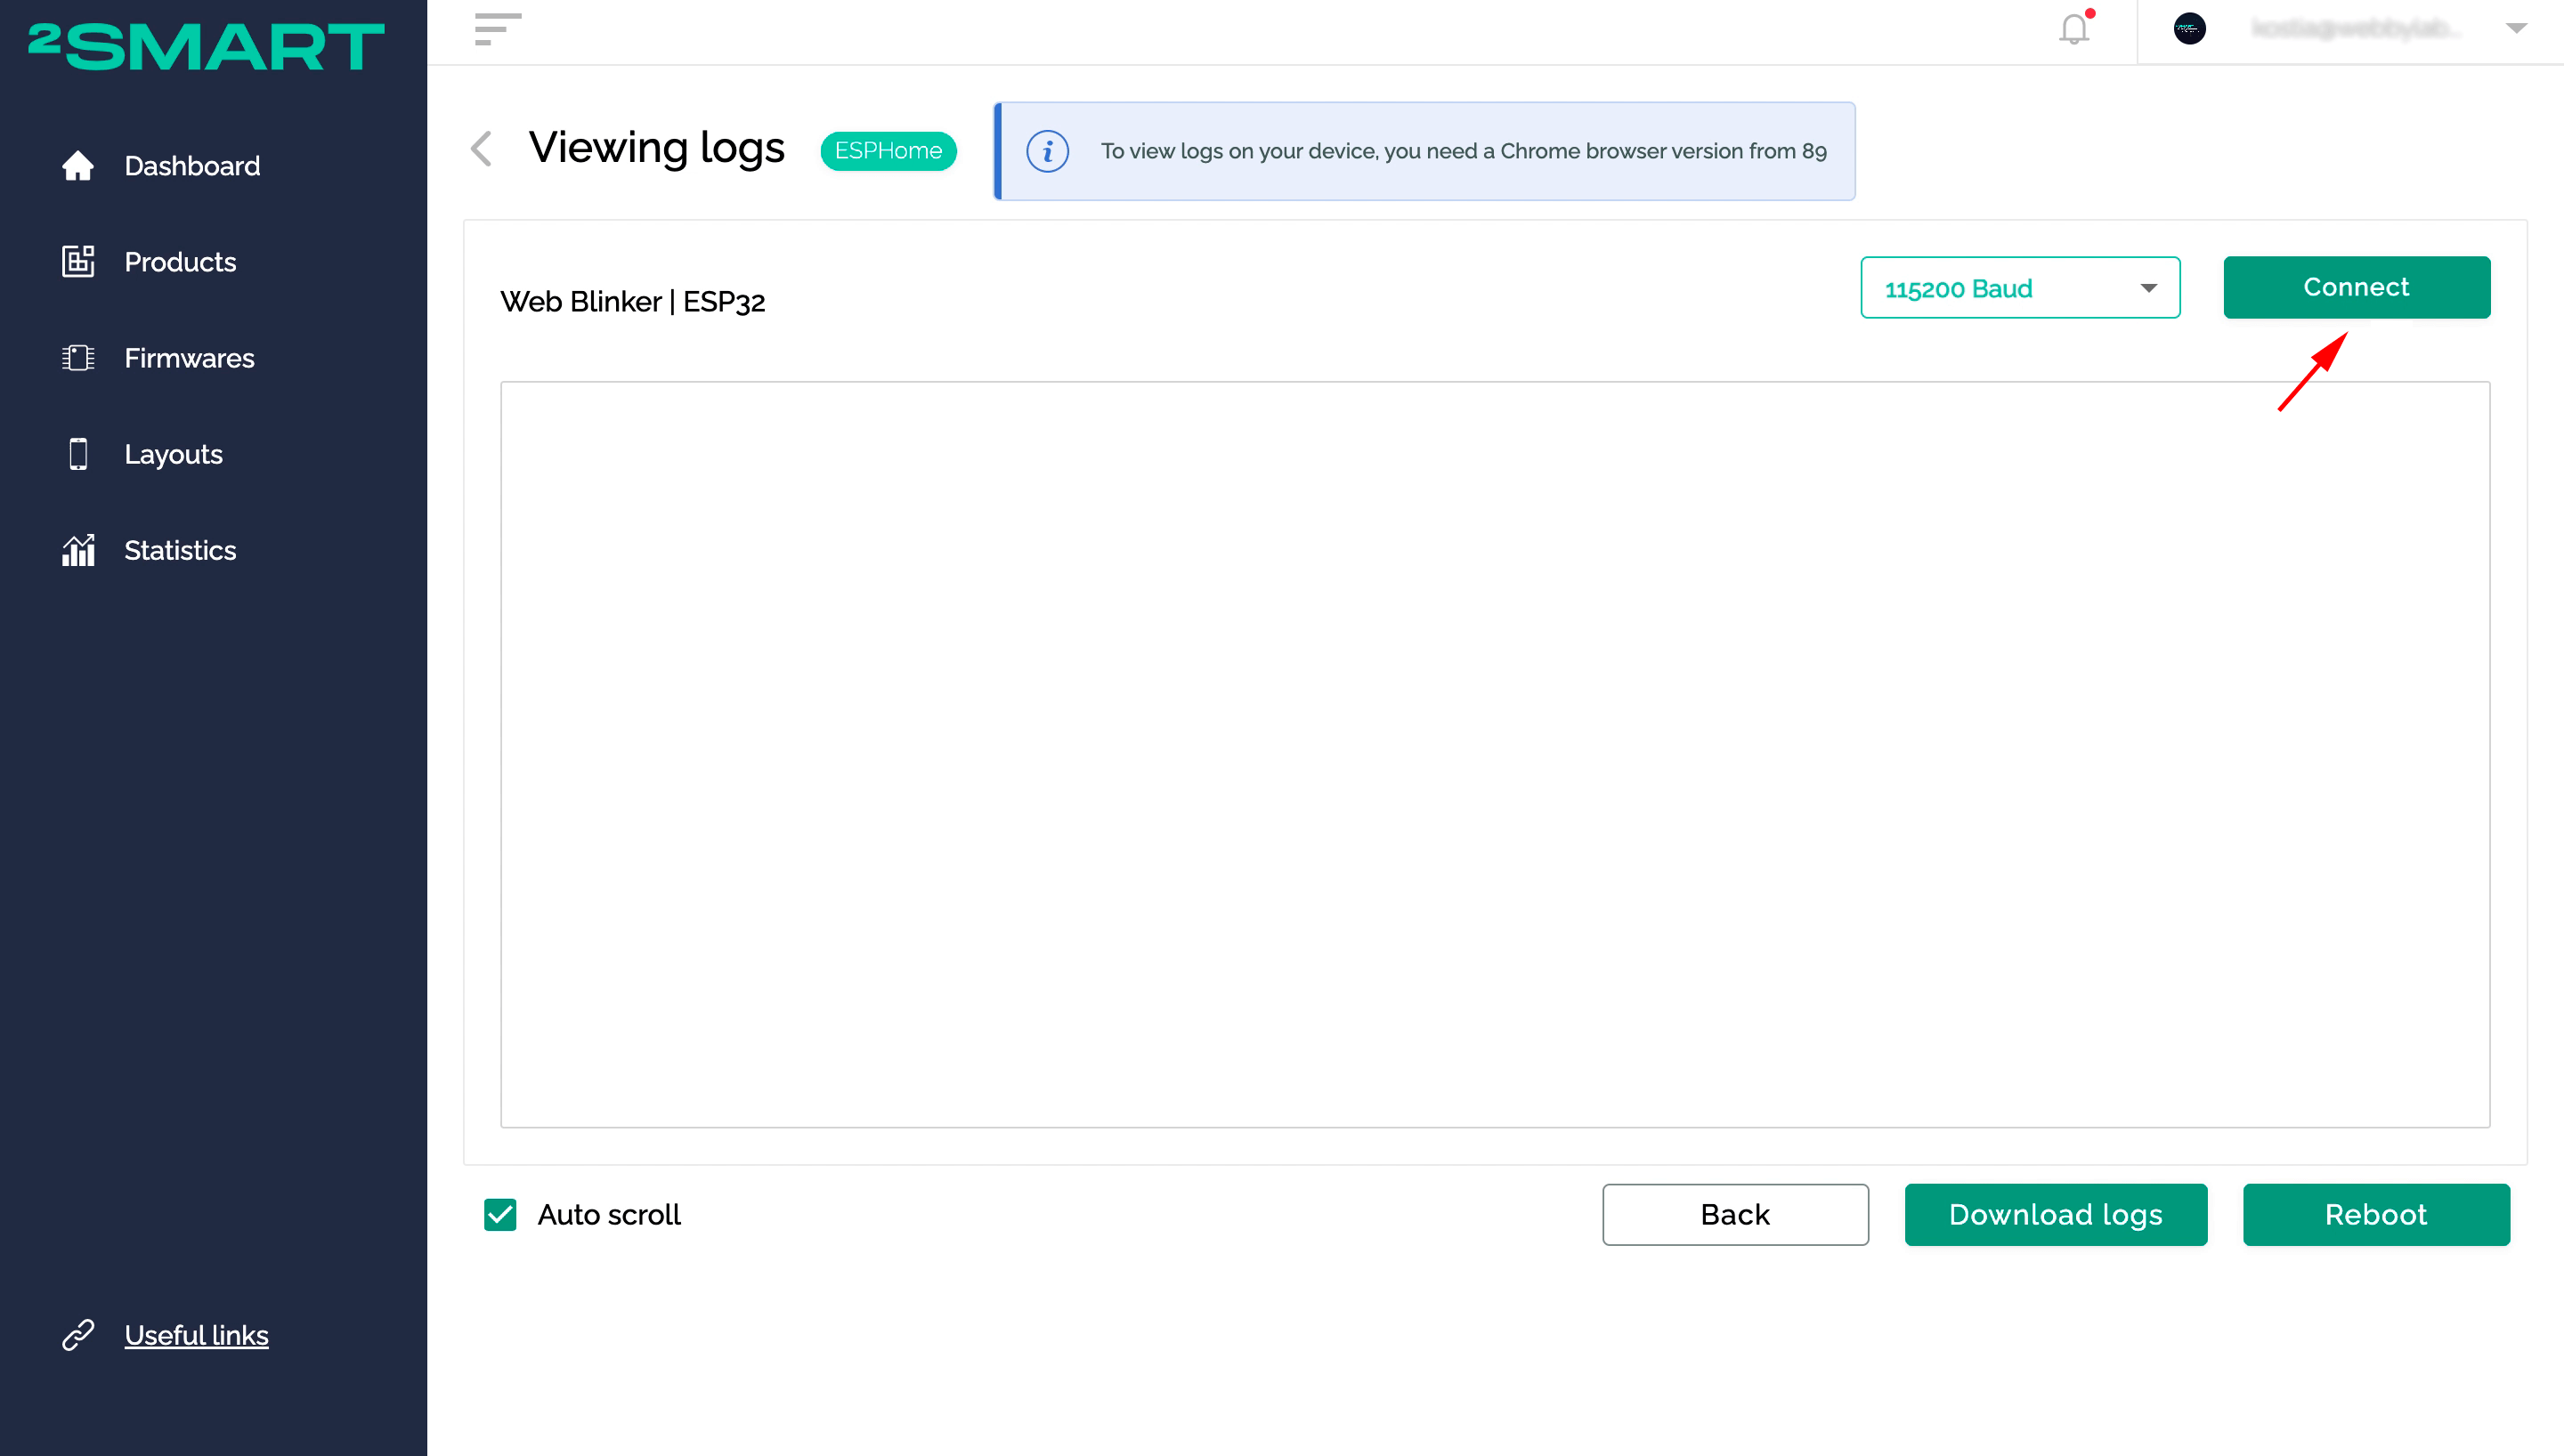
Click the “Connect” button.
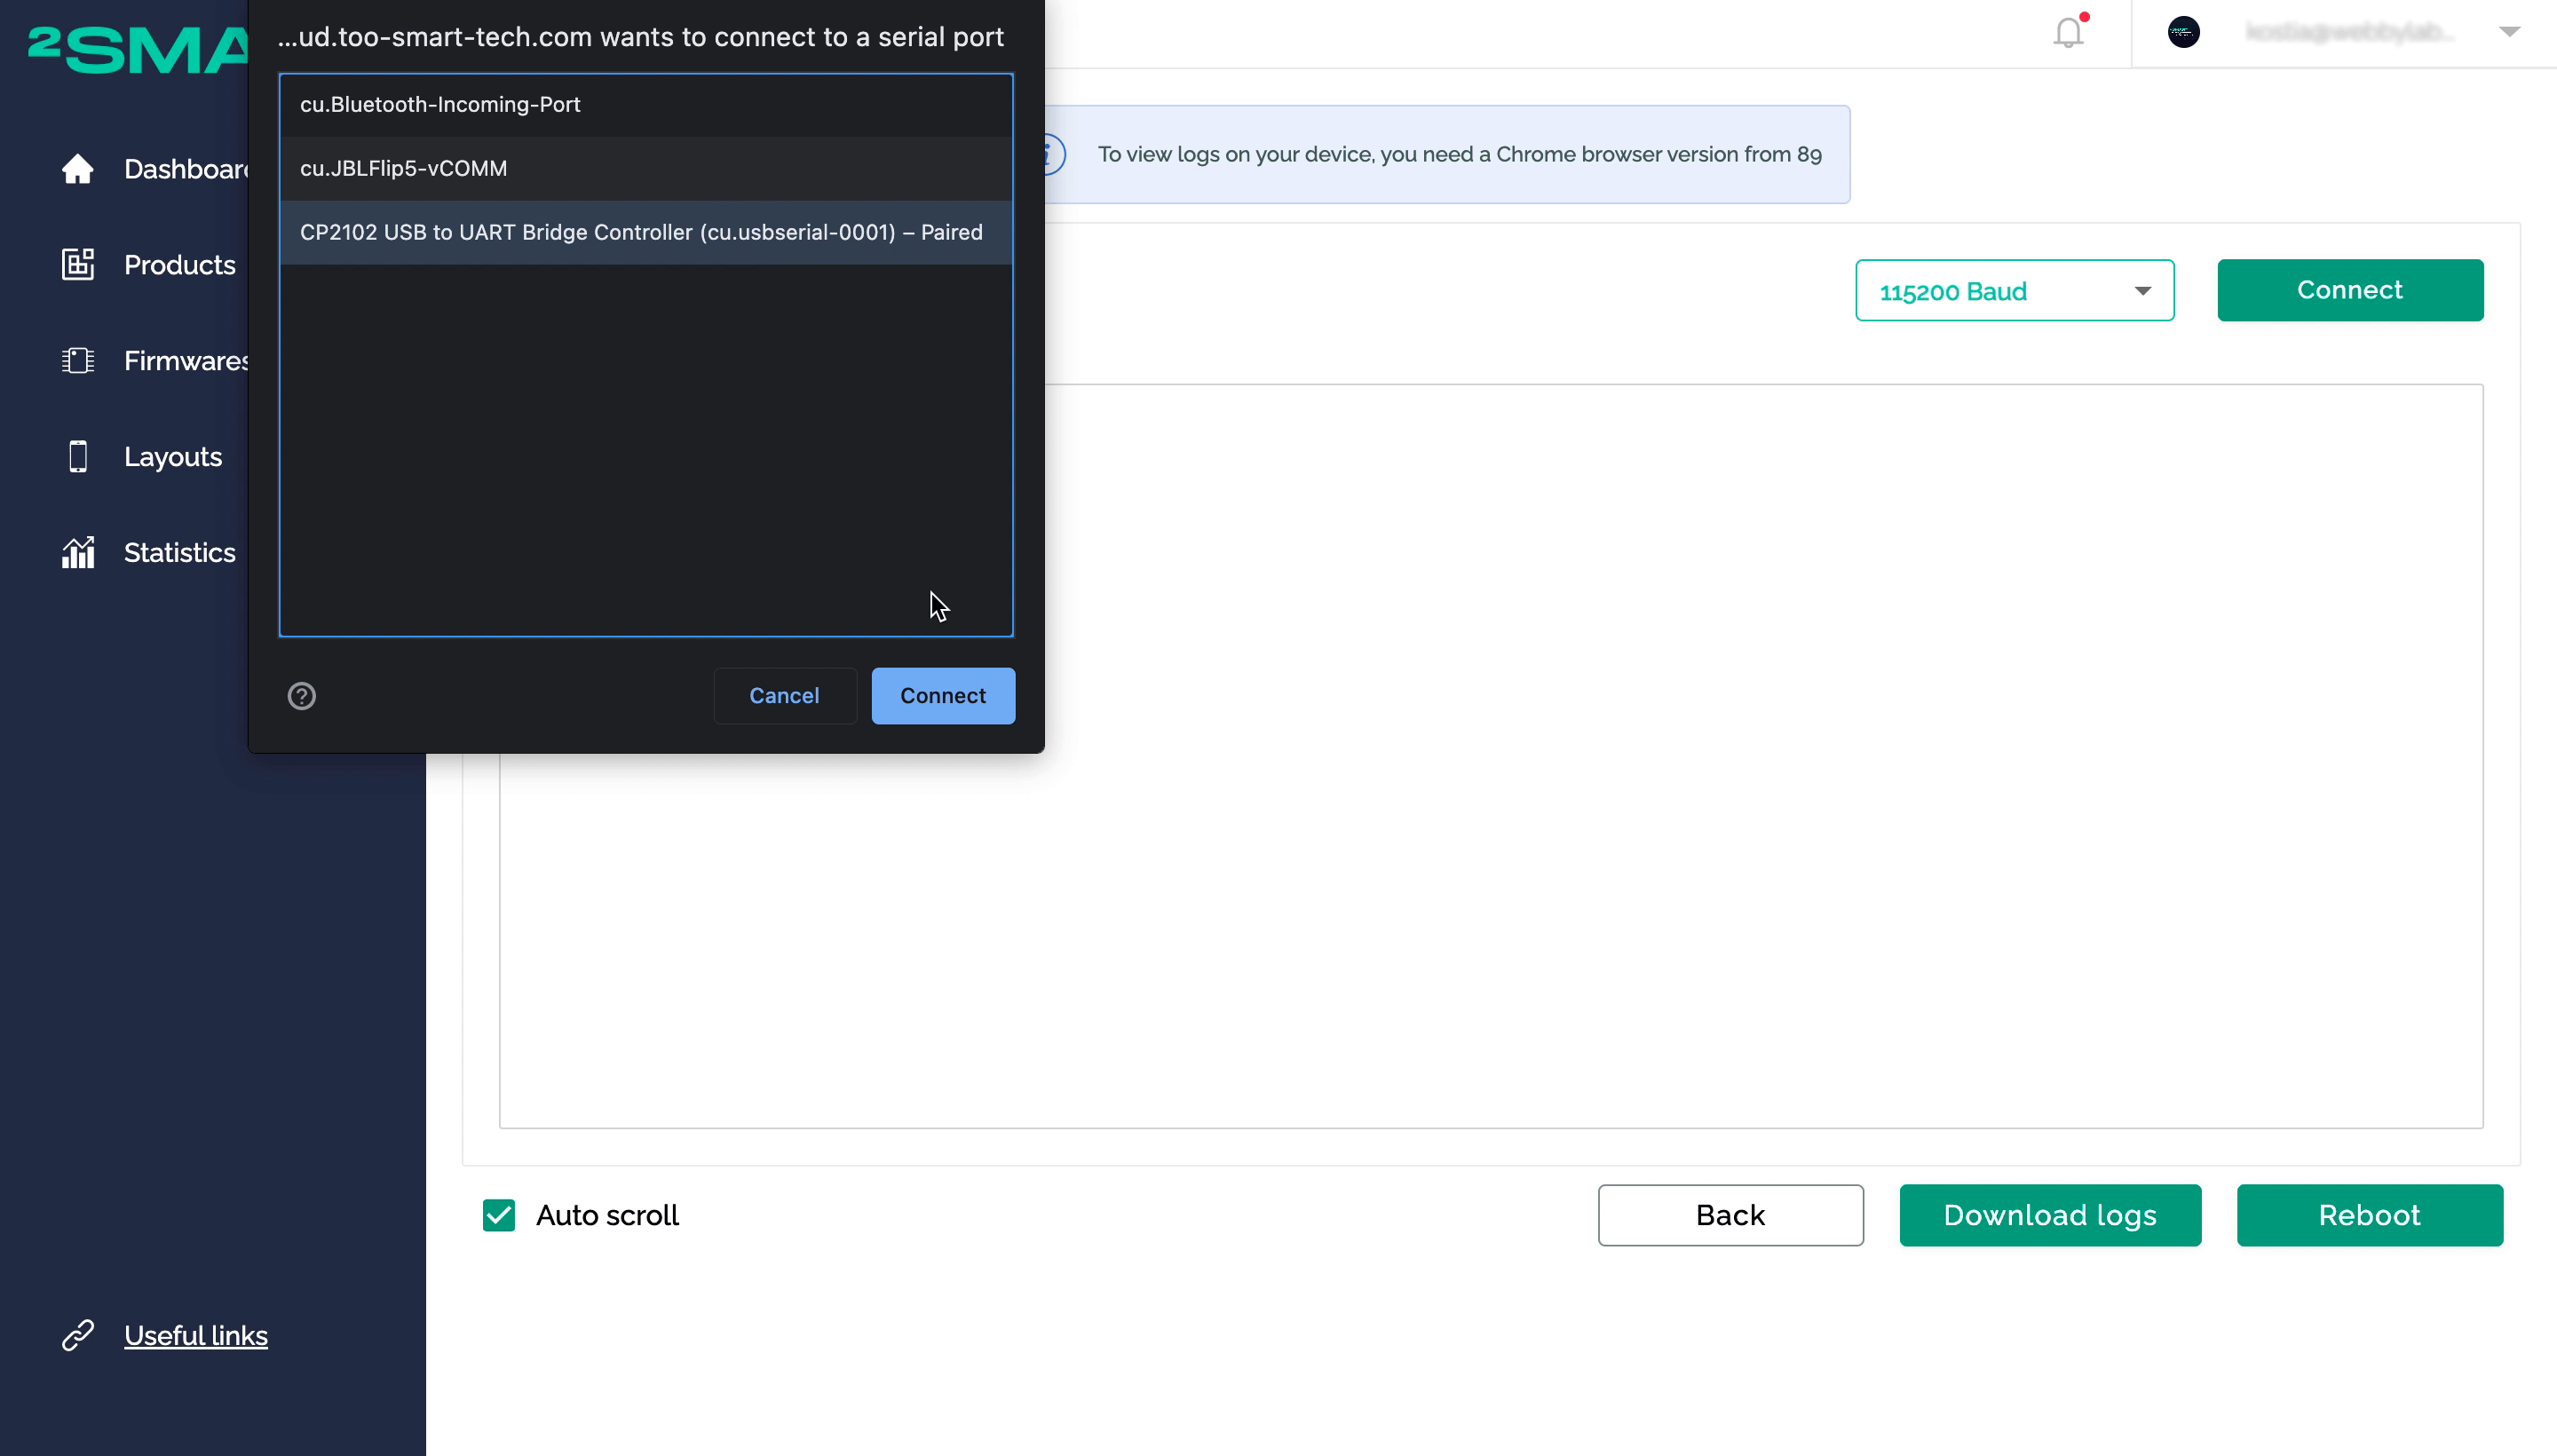
Select the computer’s serial port to which your microcontroller is connected. Click the “Connect” button.
The microcontroller logs will appear on the screen.

Use the “Download logs” button to save them to your PC.
What you need to make it work
Supported browsers:
- Google Chrome from version 89.
- Microsoft Edge from version 89.
- Opera from version 75 to 87 (could be not working some versions, better user previous browsers).
Baud rate:
ESP32 doesn’t support any but 115200 (default value).
Ubuntu:
Need to give access to the serial ports. Just add your user to the dialout group by the following command:
sudo usermod -a -G dialout <user>
After that, restart the system.
macOS:
No need to do anything but If there are no displayed serial ports in the browser, install drivers by this guide.
Windows:
Need to install Drivers. You could choose CP210x Universal Windows Driver.